Setting Up Wazuh as Your Self-Hosted Security Stack
Deploy Wazuh on your own infrastructure and gain full SIEM and XDR capabilities: real-time threat detection, file integrity monitoring, vulnerability scanning, and compliance reporting — without paying a cent for licensing.

If you manage servers, whether it's a homelab, a small business network, or production infrastructure, you need visibility into what's happening across your machines. Who logged in, what changed, what's vulnerable, what looks suspicious. That's the job of a SIEM (Security Information and Event Management), and Wazuh is the best open-source option available today.
Wazuh gives you real-time threat detection, log analysis, file integrity monitoring, vulnerability scanning, and compliance reporting across every endpoint you manage — Linux, Windows, macOS, containers, cloud workloads. It does this through lightweight agents installed on your machines that report back to a central server, where everything gets indexed, correlated, and visualized in a web dashboard.
This guide covers the full process: from spinning up the server to enrolling your first agents to tuning the platform so it's actually useful rather than just noisy. No filler, no generic "what is a SIEM?" padding — just what you need to get this running.
What Wazuh actually does
Wazuh markets itself as a "unified XDR and SIEM platform," which is accurate but abstract. In concrete terms, here's what you get once it's deployed:
Log collection and analysis. Agents on your endpoints collect system logs, application logs, authentication events, and forward them to the Wazuh server. The server runs them through a rule engine (3,000+ built-in rules mapped to the MITRE ATT&CK framework) and generates alerts when something matches — failed SSH brute-force attempts, privilege escalation, suspicious process execution, etc.
File integrity monitoring (FIM). Wazuh watches files and directories you specify and alerts you when anything changes: content, permissions, ownership, attributes. This is a hard requirement for PCI DSS compliance and invaluable for detecting unauthorized modifications on production servers.
Vulnerability detection. The agent inventories installed packages on each endpoint and cross-references them against CVE databases. You get a per-host vulnerability report directly in the dashboard, no separate scanning tool needed.
Security Configuration Assessment (SCA). Wazuh checks your endpoints against CIS benchmarks and other hardening policies, flagging misconfigurations like open ports, weak permissions, or disabled security features.
Active response. You can configure Wazuh to react automatically to certain threats — blocking an IP after repeated failed logins, killing a suspicious process, running a custom script. This moves it from passive monitoring into actual defense.
Regulatory compliance. Built-in dashboards and report templates for PCI DSS, GDPR, HIPAA, NIST 800-53, and TSC. If you're subject to any of these frameworks, Wazuh maps its detections directly to the relevant controls.
The project is licensed under GPL v2, has around 15,000 GitHub stars, and is backed by Wazuh Inc., which funds development through its managed cloud offering. The latest stable version is 4.14.3 (February 2026).
Architecture overview
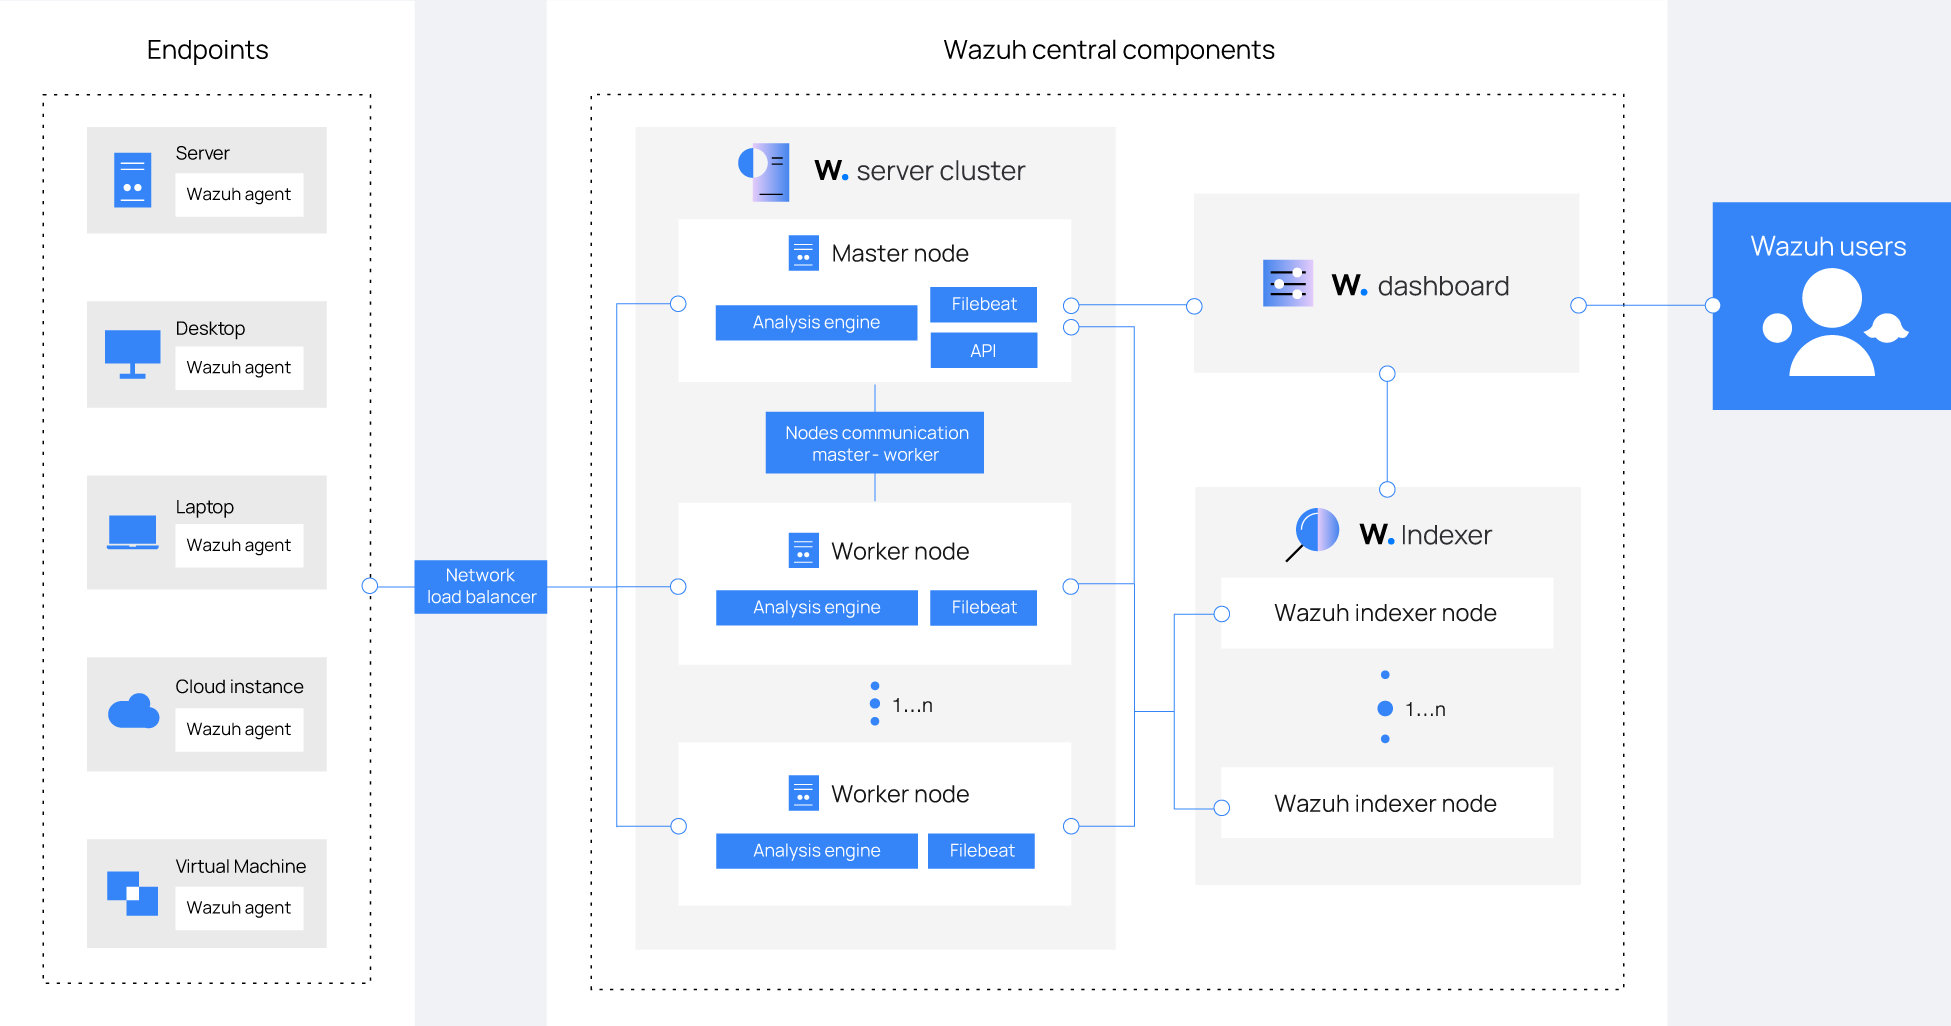
Before installing, it helps to understand what you're deploying. Wazuh has three central components plus the agents:
Wazuh server (manager). The brain. Receives data from agents, runs the analysis engine, triggers alerts, and manages agent configuration centrally. It also runs the Wazuh API (port 55000), which the dashboard and external tools use to interact with the platform.
Wazuh indexer. A fork of OpenSearch (itself a fork of Elasticsearch). Stores and indexes all alerts, making them searchable. This is the most resource-hungry component — it needs memory for JVM heap and fast disk for indexing operations.
Wazuh dashboard. A fork of OpenSearch Dashboards. The web interface where you view alerts, explore data, manage agents, run vulnerability reports, and configure the platform. Runs on port 443 by default.
Wazuh agents. Lightweight processes installed on monitored endpoints. Available for Linux, Windows, macOS, Solaris, AIX, and HP-UX. They communicate with the server on port 1514 (event data) and 1515 (enrollment).
For small to medium deployments (up to ~100 agents), all three central components run comfortably on a single server. That's the setup we'll cover here. For larger environments, you'd distribute the indexer across a cluster of nodes.
Hardware requirements
The indexer is the bottleneck. It needs memory for its JVM heap and fast storage for indexing. The analysis engine (wazuh-analysisd) is single-threaded and CPU-bound, so clock speed matters more than core count for that specific process.
All-in-one deployment (server + indexer + dashboard on one host)
| Agents | CPU | RAM | Storage |
|---|---|---|---|
| 1–25 | 4 cores | 8 GB | 50 GB SSD |
| 25–50 | 8 cores | 8 GB | 100 GB SSD |
| 50–100 | 8 cores | 8 GB | 200 GB SSD |
Storage needs depend heavily on your alert volume. The official estimate is roughly 50 GB per 90 days for the all-in-one quickstart deployment. If you're monitoring servers with heavy log output (web servers, database servers), plan for more.
SSD is not optional. The indexer performs constant read/write operations. Running on spinning disks will result in slow queries, delayed indexing, and a generally painful experience.
Supported operating systems
For the central components, stick to one of these:
- Ubuntu 22.04 or 24.04 LTS (recommended)
- Debian 11 or 12
- Red Hat Enterprise Linux 8 or 9
- CentOS 8 or 9
- Amazon Linux 2 or 2023
- AlmaLinux / Rocky Linux 8 or 9
All require x86_64 or AARCH64 architecture. The agents support a much wider range of platforms including Windows (Server 2008 R2 through 2025, desktops from 7 onward), macOS, and various Unix systems.
Method 1: All-in-one installation (recommended for most users)
This is the fastest path. Wazuh's installation assistant handles everything: it installs the indexer, server, and dashboard on the same host, generates certificates, configures all services, and hands you login credentials at the end. The whole process takes about 5–10 minutes depending on your server's internet speed.
Preparing the server
Start with a fresh server running one of the supported operating systems. You need root access and an internet connection.
Make sure these ports are accessible:
| Port | Protocol | Purpose |
|---|---|---|
| 443 | TCP | Wazuh dashboard (HTTPS) |
| 1514 | TCP | Agent event data |
| 1515 | TCP | Agent enrollment |
| 55000 | TCP | Wazuh API |
| 9200 | TCP | Wazuh indexer (internal, restrict to localhost in production) |
If you're using a cloud provider, configure these in your provider's firewall/security group. If you're on a homelab, open them on your router and/or host firewall.
A note on UFW: Docker and Wazuh's own networking can conflict with UFW in unexpected ways. If you run into connectivity issues, consider managing firewall rules at the cloud/router level or using iptables directly.
Running the installer
Download and run the installation assistant:
curl -sO https://packages.wazuh.com/4.14/wazuh-install.sh && sudo bash ./wazuh-install.sh -a
The -a flag tells it to install all components (indexer + server + dashboard) on this host.
The script will:
- Check system requirements
- Install the Wazuh indexer and initialize the cluster
- Install the Wazuh server (manager) and Filebeat
- Install the Wazuh dashboard
- Generate self-signed SSL certificates
- Output your admin credentials
When it finishes, you'll see something like:
INFO: --- Summary ---
INFO: You can access the web interface https://<YOUR_SERVER_IP>
    User: admin
    Password: <GENERATED_PASSWORD>
INFO: Installation finished.
Save that password immediately. It's shown only once during installation. You can also retrieve all generated passwords later with:
sudo tar -O -xvf wazuh-install-files.tar wazuh-install-files/wazuh-passwords.txt
Accessing the dashboard
Open https://YOUR_SERVER_IP in your browser. You'll get a certificate warning because the installation uses self-signed certificates — this is expected. Accept the exception and log in with the admin credentials.
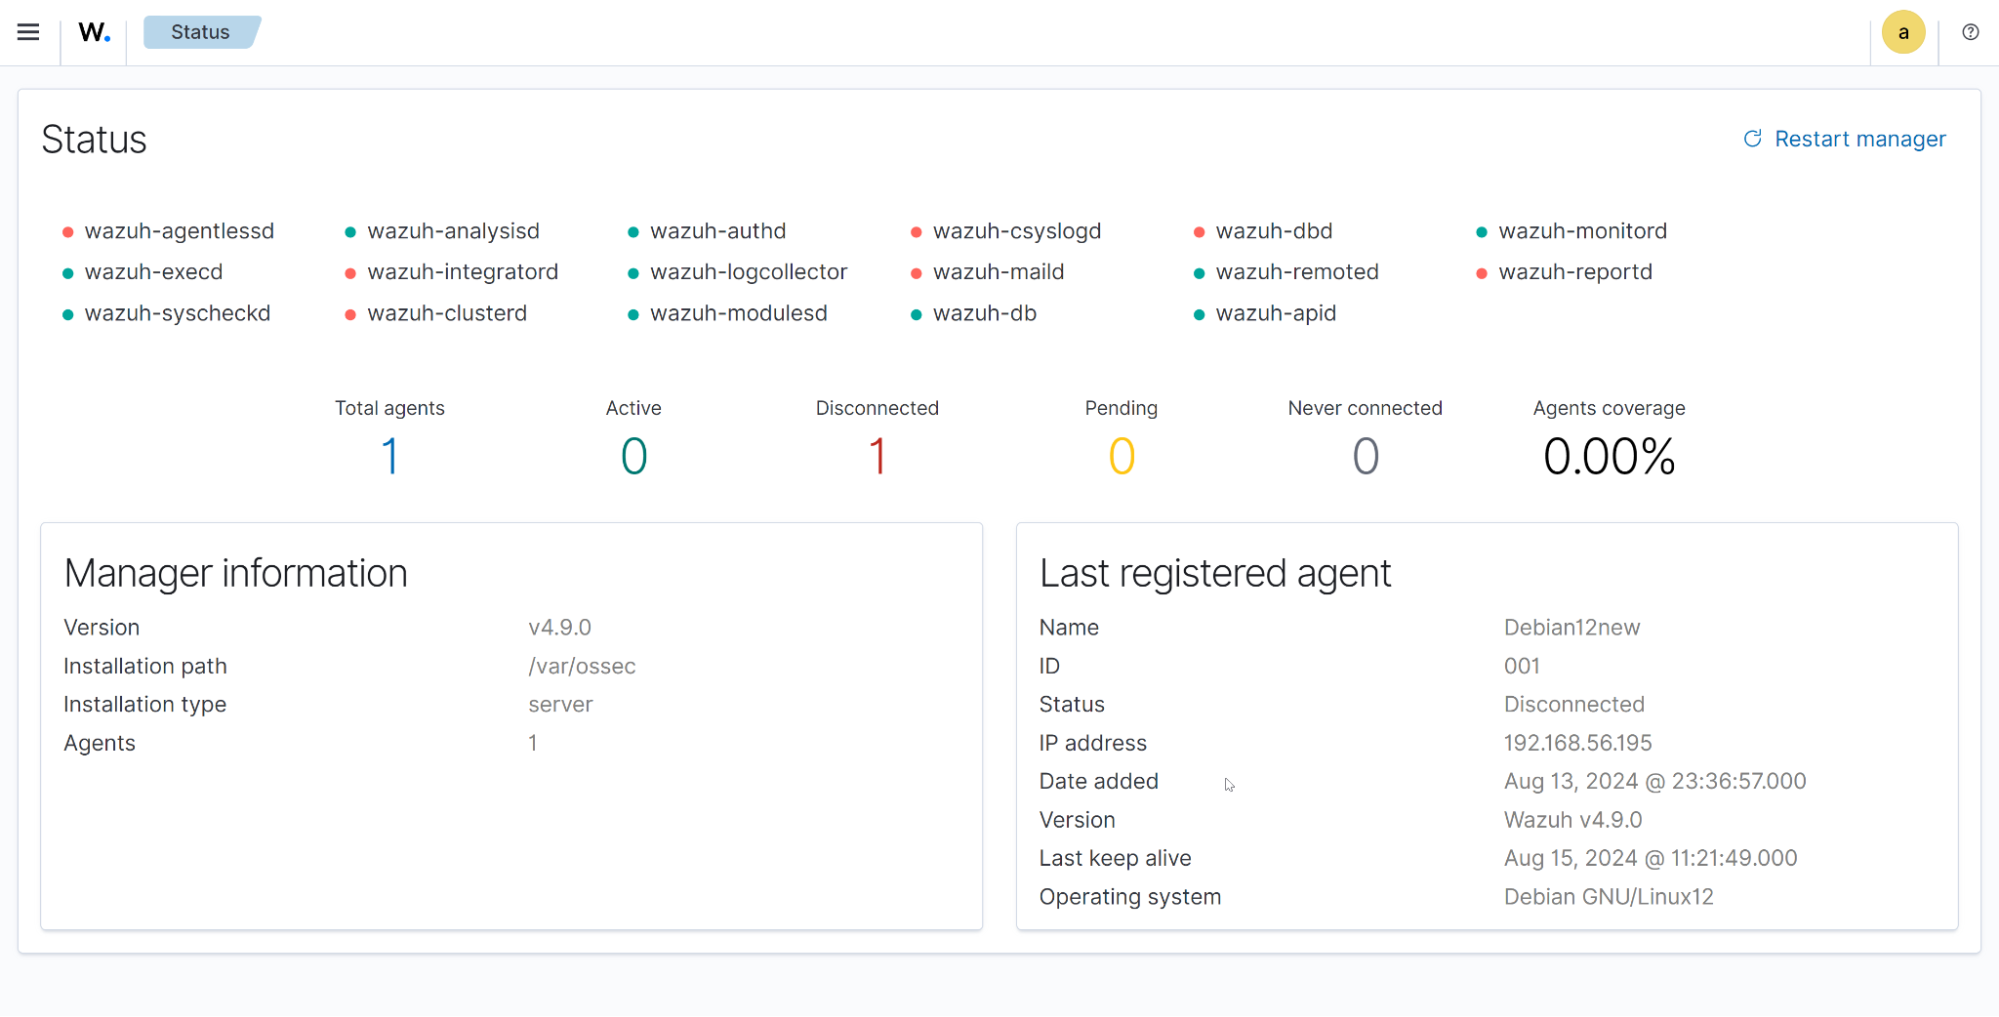
The dashboard will show zero active agents, which is normal. The next step is enrolling endpoints.
Post-installation: disable repository auto-updates
Wazuh recommends disabling its package repositories after installation to prevent accidental upgrades that could break your environment. This is good advice — you want to control when updates happen.
# For Debian/Ubuntu
sudo sed -i "s/^deb/#deb/" /etc/apt/sources.list.d/wazuh.list
sudo apt-get update

# For RHEL/CentOS/AlmaLinux/Rocky
sudo sed -i "s/^enabled=1/enabled=0/" /etc/yum.repos.d/wazuh.repo
Method 2: Docker deployment
If you prefer containers or already run Docker on your infrastructure, Wazuh provides official Docker images with both single-node and multi-node configurations.
Prerequisites
- Docker Engine (latest stable)
- Docker Compose V2 (
docker composeplugin syntax) - Git
- At least 6 GB of RAM available to the Docker host
Critical kernel setting: The Wazuh indexer requires a higher memory map limit. Set it before deploying:
# Apply immediately
sudo sysctl -w vm.max_map_count=262144

# Make persistent across reboots
echo "vm.max_map_count=262144" | sudo tee -a /etc/sysctl.conf
On Windows with WSL2, run this inside the WSL2 terminal.
Single-node deployment
Clone the official repository and check out the latest release:
git clone https://github.com/wazuh/wazuh-docker.git -b v4.14.3
cd wazuh-docker/single-node
Generate the SSL certificates:
docker compose -f generate-indexer-certs.yml run --rm generator
Start the stack:
docker compose up -d
This brings up three containers: wazuh.manager, wazuh.indexer, and wazuh.dashboard. The dashboard will be available at https://localhost (or your Docker host's IP) once the indexer finishes initializing, which typically takes about a minute.
Default credentials are admin / SecretPassword. Change these immediately — the process for changing passwords is documented in the Wazuh Docker utilities section of the official docs.
Data persistence
The Docker Compose file defines named volumes for all persistent data. Your configuration, indexed alerts, and agent data survive container restarts and image updates. Check the volumes section in docker-compose.yml to understand what's stored where and adjust mount paths if needed.
Customizing the configuration
The configuration files are mounted from the config/ directory into the containers. To customize:
- Wazuh manager: edit
config/wazuh_cluster/wazuh_manager.conf - Wazuh indexer: edit files in
config/wazuh_indexer/ - Wazuh dashboard: edit
config/wazuh_dashboard/opensearch_dashboards.yml
After any configuration change, restart the stack:
docker compose restart
Enrolling agents
A Wazuh deployment with no agents isn't doing much. Here's how to get your endpoints reporting.
Enrolling from the dashboard (easiest)
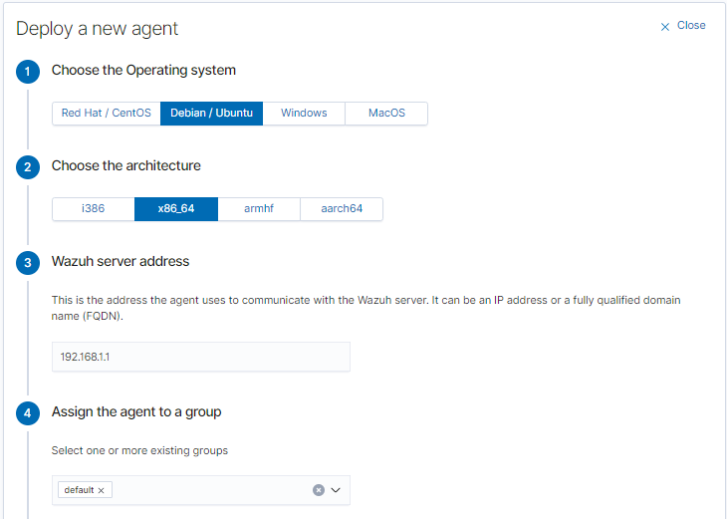
The dashboard provides a guided agent deployment wizard:
- Go to Server management → Endpoints Summary
- Click Deploy new agent
- Select the target OS (Linux, Windows, macOS)
- Enter your Wazuh server address
- Optionally assign an agent name and group
- Copy the generated installation command
The wizard generates a one-liner that downloads and installs the agent with the correct server address pre-configured.
Linux agent installation
On the target machine, run the command generated by the wizard. For example, on a Debian/Ubuntu system:
wget https://packages.wazuh.com/4.x/apt/pool/main/w/wazuh-agent/wazuh-agent_4.14.3-1_amd64.deb
sudo WAZUH_MANAGER='YOUR_WAZUH_SERVER_IP' dpkg -i ./wazuh-agent_4.14.3-1_amd64.deb
sudo systemctl daemon-reload
sudo systemctl enable wazuh-agent
sudo systemctl start wazuh-agent
For RHEL/CentOS/AlmaLinux:
sudo WAZUH_MANAGER='YOUR_WAZUH_SERVER_IP' rpm -ihv wazuh-agent-4.14.3-1.x86_64.rpm
sudo systemctl daemon-reload
sudo systemctl enable wazuh-agent
sudo systemctl start wazuh-agent
Verify the agent is running and connected:
sudo systemctl status wazuh-agent
It should report active (running). Within a minute or two, the agent will appear in your dashboard.
Windows agent installation
Download the MSI installer from the Wazuh packages page or use the command from the deployment wizard. You can install silently from an elevated command prompt or PowerShell:
Invoke-WebRequest -Uri https://packages.wazuh.com/4.x/windows/wazuh-agent-4.14.3-1.msi -OutFile wazuh-agent.msi
msiexec.exe /i wazuh-agent.msi /q WAZUH_MANAGER="YOUR_WAZUH_SERVER_IP"
NET START Wazuh
Alternatively, run the MSI installer with the GUI wizard, which will prompt you for the server address.
macOS agent installation
curl -so wazuh-agent.pkg https://packages.wazuh.com/4.x/macos/wazuh-agent-4.14.3-1.intel64.pkg
sudo WAZUH_MANAGER='YOUR_WAZUH_SERVER_IP' installer -pkg ./wazuh-agent.pkg -target /
sudo /Library/Ossec/bin/wazuh-control start
For Apple Silicon Macs, use the arm64 package variant instead.
Verifying enrollment
Back in the dashboard, navigate to Server management → Endpoints Summary. Your new agents should appear with an "Active" status. Click on any agent to see its details, inventory data, and incoming alerts.
If an agent shows as "Disconnected" or doesn't appear at all:
- Check that the agent can reach the server on ports 1514 and 1515 (
telnet YOUR_SERVER_IP 1514) - Verify the manager address in the agent configuration (
/var/ossec/etc/ossec.confon Linux,C:\Program Files (x86)\ossec-agent\ossec.confon Windows) - Check agent logs:
/var/ossec/logs/ossec.logon Linux,C:\Program Files (x86)\ossec-agent\ossec.logon Windows
Configuring what Wazuh monitors
Out of the box, Wazuh monitors a reasonable set of things on each agent. But to get real value, you should tune it to your environment.
Centralized vs local configuration
You have two approaches:
Centralized (recommended): Edit /var/ossec/etc/shared/default/agent.conf on the Wazuh server. Changes propagate automatically to all agents in the group. This is the right approach when you manage many endpoints.
Local: Edit /var/ossec/etc/ossec.conf on each individual agent. Useful for one-off configurations on specific hosts.
File integrity monitoring
By default, FIM monitors a standard set of system directories. To add your own:
In the centralized agent.conf (on the server):
<agent_config>
  <syscheck>
    <directories realtime="yes">/var/www</directories>
    <directories realtime="yes" check_sha256="yes">/etc/nginx</directories>
    <directories whodata="yes">/etc/ssh</directories>
    <!-- Ignore noisy files -->
    <ignore>/var/www/app/logs</ignore>
    <ignore type="sregex">.swp$</ignore>
  </syscheck>
</agent_config>
The realtime="yes" attribute enables inotify-based monitoring on Linux (instant alerts on changes). The whodata="yes" attribute goes further by also recording who made the change (requires auditd on Linux).
Log collection
To collect logs from a specific application, add a <localfile> block. For example, to collect Nginx access and error logs:
<agent_config os="Linux">
  <localfile>
    <log_format>syslog</log_format>
    <location>/var/log/nginx/access.log</location>
  </localfile>
  <localfile>
    <log_format>syslog</log_format>
    <location>/var/log/nginx/error.log</location>
  </localfile>
</agent_config>
For JSON-formatted logs (common with modern applications):
<localfile>
  <log_format>json</log_format>
  <location>/var/log/myapp/events.json</location>
</localfile>
Wazuh can also collect Windows Event Logs, with granular control over which event channels to monitor:
<agent_config os="Windows">
  <localfile>
    <location>Security</location>
    <log_format>eventchannel</log_format>
    <query>Event/System[EventID != 5145 and EventID != 5156]</query>
  </localfile>
  <localfile>
    <location>Microsoft-Windows-Sysmon/Operational</location>
    <log_format>eventchannel</log_format>
  </localfile>
</agent_config>
Adding Sysmon logs is highly recommended on Windows endpoints — it dramatically improves visibility into process creation, network connections, and file changes.
Vulnerability detection
Vulnerability detection is enabled by default on the server side. The agent automatically collects installed package information (Syscollector) and the server cross-references this against CVE databases.
To check or adjust the configuration, look in the server's ossec.conf:
<vulnerability-detection>
  <enabled>yes</enabled>
  <index-status>yes</index-status>
  <feed-update-interval>60m</feed-update-interval>
</vulnerability-detection>
Vulnerability results appear in the dashboard under Threat intelligence → Vulnerability detection. You can filter by severity, agent, or specific CVE ID.
Security Configuration Assessment
SCA policies are enabled by default and vary by OS. The agent runs checks against CIS benchmarks and reports the results. You can see which policies are active and their results under the Configuration Assessment section of each agent's page in the dashboard.
To add custom SCA policies or disable default ones, modify the <sca> block in the agent configuration.
Writing custom rules and decoders
Wazuh's built-in ruleset covers a lot of ground, but every environment has unique detection needs. Custom rules let you create alerts specific to your applications and threat model.
How rules work
Rules are XML files stored in /var/ossec/etc/rules/ on the server. Each rule matches on specific fields extracted from logs by decoders. When a log line matches a rule, an alert is generated with the rule's ID, level, and description.
Rule levels range from 0 (ignored) to 15 (critical). Levels 0–3 are typically informational, 4–7 are low-to-medium, and 8+ trigger alerts in the dashboard.
Example: detecting a custom application event
Suppose your application logs JSON events to /var/log/myapp/events.json with entries like:
{"timestamp": "2026-02-25T10:30:00Z", "event": "login_failed", "user": "admin", "ip": "203.0.113.50", "attempts": 5}
First, create a decoder in /var/ossec/etc/decoders/local_decoder.xml:
<decoder name="myapp">
  <prematch>^{"timestamp"</prematch>
  <plugin_decoder>JSON_Decoder</plugin_decoder>
</decoder>
Then, create a rule in /var/ossec/etc/rules/local_rules.xml:
<group name="myapp,authentication,">
  <rule id="100001" level="5">
    <decoded_as>myapp</decoded_as>
    <field name="event">^login_failed$</field>
    <description>MyApp: Failed login attempt by $(user) from $(ip)</description>
    <mitre>
      <id>T1110</id>
    </mitre>
  </rule>

  <rule id="100002" level="10" frequency="5" timeframe="120">
    <if_matched_sid>100001</if_matched_sid>
    <same_field>ip</same_field>
    <description>MyApp: Brute-force attack detected from $(ip)</description>
    <mitre>
      <id>T1110.001</id>
    </mitre>
  </rule>
</group>
Rule 100001 fires on any failed login (level 5, low severity). Rule 100002 fires when 5 or more failed logins from the same IP happen within 120 seconds (level 10, high severity), and it's mapped to the MITRE ATT&CK technique for brute-force attacks.
After adding rules, restart the manager:
sudo systemctl restart wazuh-manager
Or, if on 4.14+, use the hot-reload API endpoint to apply changes without restarting:
curl -k -X PUT "https://localhost:55000/manager/restart" -H "Authorization: Bearer $TOKEN"
Testing rules
Use wazuh-logtest to validate your rules before deploying them to production:
sudo /var/ossec/bin/wazuh-logtest
Paste a sample log line, and it'll show you which decoder and rule matched, along with the extracted fields. This is invaluable for debugging — use it every time you write a new rule.
Setting up active response
Active response lets Wazuh take automated action when specific rules trigger. The most common use case is blocking IP addresses after brute-force attacks.
Blocking IPs with the built-in firewall-drop
Wazuh includes a firewall-drop script that adds iptables rules (Linux) or netsh rules (Windows) to block offending IPs. To enable it, add this to the server's ossec.conf:
<active-response>
  <command>firewall-drop</command>
  <location>local</location>
  <rules_id>5763</rules_id>
  <timeout>600</timeout>
</active-response>
This blocks the source IP for 600 seconds (10 minutes) whenever rule 5763 (SSH brute-force) triggers. The local location means the response executes on the agent that generated the alert.
You can also use <location>server</location> to execute on the server, or <location>all</location> to execute on all agents (useful for network-wide IP blocking).
Custom active response scripts
For anything beyond IP blocking, you can write custom scripts. Place them in /var/ossec/active-response/bin/ on the agents, make them executable, and reference them in the configuration.
Example: a script that sends a Slack notification when a critical alert fires:
#!/bin/bash
# /var/ossec/active-response/bin/slack-notify.sh

WEBHOOK_URL="https://hooks.slack.com/services/YOUR/WEBHOOK/URL"
ALERT_MSG="$*"

curl -s -X POST -H 'Content-type: application/json' \
  --data "{\"text\": \"🚨 Wazuh Alert: ${ALERT_MSG}\"}" \
  "$WEBHOOK_URL"

exit 0
Register it in ossec.conf:
<command>
  <name>slack-notify</name>
  <executable>slack-notify.sh</executable>
  <timeout_allowed>no</timeout_allowed>
</command>

<active-response>
  <command>slack-notify</command>
  <location>server</location>
  <level>12</level>
</active-response>
This sends a Slack notification for any alert at level 12 or above.
Integrations worth setting up
Syslog input (network devices, firewalls)
For devices that can't run a Wazuh agent (routers, firewalls, switches, printers), configure them to send syslog to your Wazuh server. Add a syslog listener in the server's ossec.conf:
<remote>
  <connection>syslog</connection>
  <port>514</port>
  <protocol>udp</protocol>
  <allowed-ips>192.168.1.0/24</allowed-ips>
</remote>
Restart the manager, and logs from those devices will flow into Wazuh's analysis engine.
VirusTotal integration
Wazuh can automatically check file hashes against VirusTotal's database when FIM detects new or modified files. Enable it by adding your VirusTotal API key to ossec.conf:
<integration>
  <name>virustotal</name>
  <api_key>YOUR_VIRUSTOTAL_API_KEY</api_key>
  <group>syscheck</group>
  <alert_format>json</alert_format>
</integration>
The free VirusTotal API allows 4 lookups per minute, which is usually sufficient for FIM events. Matches generate their own alerts with the VirusTotal detection ratio.
Slack / email notifications
Beyond active response, you can configure Wazuh to send alert notifications through various channels. For email, configure the <global> section in ossec.conf:
<global>
  <email_notification>yes</email_notification>
  <smtp_server>smtp.gmail.com</smtp_server>
  <email_from>[email protected]</email_from>
  <email_to>[email protected]</email_to>
  <email_maxperhour>12</email_maxperhour>
</global>
For Slack, Teams, PagerDuty, and other platforms, use the integration framework with custom scripts or community-maintained integrations.
Reverse proxy and SSL with a proper certificate
The default self-signed certificate works, but if you're exposing the dashboard externally or just want to stop seeing browser warnings, put it behind a reverse proxy with Let's Encrypt.
Caddy (simplest option)
wazuh.yourdomain.com {
    reverse_proxy https://localhost:443 {
        transport http {
            tls_insecure_skip_verify
        }
    }
}
Caddy handles Let's Encrypt automatically. The tls_insecure_skip_verify is needed because the upstream (Wazuh dashboard) uses a self-signed certificate.
Nginx
server {
    listen 443 ssl;
    server_name wazuh.yourdomain.com;

    ssl_certificate /etc/letsencrypt/live/wazuh.yourdomain.com/fullchain.pem;
    ssl_certificate_key /etc/letsencrypt/live/wazuh.yourdomain.com/privkey.pem;

    location / {
        proxy_pass https://127.0.0.1:443;
        proxy_ssl_verify off;
        proxy_set_header Host $host;
        proxy_set_header X-Real-IP $remote_addr;
        proxy_set_header X-Forwarded-For $proxy_add_x_forwarded_for;
        proxy_set_header X-Forwarded-Proto $scheme;
        proxy_http_version 1.1;
        proxy_set_header Upgrade $http_upgrade;
        proxy_set_header Connection "upgrade";
    }
}
Use Certbot to obtain and auto-renew the Let's Encrypt certificate.
If you're running Wazuh behind Coolify, you can leverage its built-in Traefik proxy for automatic SSL, though you'll need to configure the Docker deployment method and ensure proper port mapping.
Maintenance and operations
Backing up Wazuh
The critical data to back up:
- Wazuh manager configuration and rules:
/var/ossec/etc/(includesossec.conf, custom rules, decoders, agent groups, keys) - Wazuh indexer data: the indexed alerts. For small deployments, you can snapshot the data directory. For larger ones, use the indexer's built-in snapshot/restore API
- Agent keys:
/var/ossec/etc/client.keys— losing this means re-enrolling all agents - Certificates:
/etc/wazuh-indexer/certs/,/etc/wazuh-dashboard/certs/
A simple backup script:
#!/bin/bash
BACKUP_DIR="/backup/wazuh/$(date +%Y%m%d)"
mkdir -p "$BACKUP_DIR"

# Manager config and rules
sudo tar czf "$BACKUP_DIR/wazuh-manager-etc.tar.gz" /var/ossec/etc/

# Indexer snapshot (use API for large deployments)
sudo tar czf "$BACKUP_DIR/wazuh-indexer-data.tar.gz" /var/lib/wazuh-indexer/

echo "Backup completed: $BACKUP_DIR"
For Docker deployments, back up the named volumes instead.
Updating Wazuh
Updates should be done deliberately, not automatically. The process:
- Read the release notes for the target version
- Back up everything (see above)
- Re-enable the Wazuh repository
- Update packages in order: indexer first, then server, then dashboard
- Update agents (can be done remotely through the API or dashboard)
- Disable the repository again
For the central components on Debian/Ubuntu:
# Re-enable repo
sudo sed -i "s/^#deb/deb/" /etc/apt/sources.list.d/wazuh.list
sudo apt-get update

# Update in order
sudo apt-get install wazuh-indexer
sudo systemctl restart wazuh-indexer

sudo apt-get install wazuh-manager
sudo systemctl restart wazuh-manager

sudo apt-get install wazuh-dashboard
sudo systemctl restart wazuh-dashboard

# Disable repo again
sudo sed -i "s/^deb/#deb/" /etc/apt/sources.list.d/wazuh.list
Important: All central components must run the same version. The manager must always be the same version or newer than the agents.
For Docker deployments, the update process involves pulling new image tags and recreating containers — your data persists in volumes.
Managing disk space
The indexer will consume more disk over time as alerts accumulate. Wazuh uses Index State Management (ISM) policies to manage data lifecycle. By default, indices older than a configured retention period can be automatically deleted.
Check your current index sizes:
curl -k -u admin:YOUR_PASSWORD "https://localhost:9200/_cat/indices?v&s=store.size:desc"
To adjust retention, modify the ISM policy through the dashboard (under Indexer management → Index Management → State Management Policies) or via the API.
Troubleshooting
"wazuh-analysisd: Queue full" in server logs
The analysis engine can't keep up with incoming events. Either reduce the volume (disable noisy log sources, add exclusion rules) or increase the queue size in /var/ossec/etc/internal_options.conf:
analysisd.event_threads=0
analysisd.syscheck_threads=0
analysisd.syscollector_threads=0
Setting threads to 0 means auto-detect based on CPU cores. Also check if you have rules generating excessive alerts on routine events.
Indexer won't start / OutOfMemoryError
The JVM heap is too small or the host doesn't have enough RAM. Check and adjust the JVM settings:
# Check current heap
cat /etc/wazuh-indexer/jvm.options.d/*.options

# Set heap to 50% of available RAM (never more than 32GB)
echo "-Xms4g" | sudo tee /etc/wazuh-indexer/jvm.options.d/heap.options
echo "-Xmx4g" | sudo tee -a /etc/wazuh-indexer/jvm.options.d/heap.options
sudo systemctl restart wazuh-indexer
For Docker deployments, set the OPENSEARCH_JAVA_OPTS environment variable in docker-compose.yml.
Agent can't connect to manager
Run through this checklist:
- Network: Can the agent reach the server?
telnet SERVER_IP 1514 - Firewall: Is port 1514 open on the server?
- Manager address: Is it correct in
/var/ossec/etc/ossec.confon the agent? - Manager running:
sudo systemctl status wazuh-manager— is it active? - Logs: Check
/var/ossec/logs/ossec.logon both the agent and server for specific error messages
Dashboard shows "Wazuh API is not reachable"
The dashboard can't communicate with the Wazuh API on port 55000. Check:
# Is the API running?
sudo systemctl status wazuh-manager

# Can you reach it locally?
curl -k -u wazuh-wui:$(sudo tar -O -xvf wazuh-install-files.tar wazuh-install-files/wazuh-passwords.txt 2>/dev/null | grep "wazuh-wui" | awk '{print $NF}') https://localhost:55000/

# Check API logs
sudo tail -f /var/ossec/logs/api.log
High alert noise
This is the most common complaint with any SIEM. The solution isn't to disable alerts but to tune them:
- Group agents: Create groups for different server types (web servers, databases, desktops) and apply targeted configurations to each
- Adjust rule levels: Override built-in rules with custom levels in
local_rules.xmlto suppress low-value alerts - Use syscheck exclusions: Exclude directories and files that change frequently but aren't security-relevant (log rotation, temp files, cache directories)
- Leverage CDB lists: Create lists of known-good IPs, users, or hashes and use them in rules to reduce false positives
Getting help
- Official documentation: documentation.wazuh.com — comprehensive and well-maintained
- Wazuh Slack: Active community with fast responses from both users and Wazuh staff
- GitHub Issues: github.com/wazuh/wazuh/issues for bug reports
- GitHub Discussions: For general questions and feature requests
- Reddit: r/Wazuh for community discussions
- Discord: Community Discord server for real-time help
When asking for help, include: your Wazuh version, OS, the relevant section of ossec.conf, and relevant log entries from /var/ossec/logs/ossec.log.
Wazuh isn't a "set it and forget it" tool. The real value comes from tuning it to your environment, writing rules that match your threat model, and actually reviewing the alerts it generates. But once you invest that time, you end up with something that commercial SIEM solutions charge tens of thousands of dollars per year for — running entirely on your own infrastructure, under your control, at the cost of a VPS.
Start with the all-in-one installation, enroll a couple of agents, and spend a week learning the dashboard and alert patterns. Then start layering in custom rules, active responses, and integrations as you identify what matters most for your environment.
This guide is maintained by the selfhostyourself.com team. For more ideas on what to run alongside Wazuh, check out Uptime Kuma for service monitoring or explore our full directory of self-hosted services.